CONSERVE. PLAN. GROW.®
Corporate Cash Allocation Decisions
July 1, 2014
Although the economic recovery since the 2008 financial crisis has been less than robust, companies have been doing quite well. Corporate profits as a percentage of GDP are at record levels, as companies have benefitted from the tailwinds of low interest and labor costs, while also focusing on the bottom line. This operational proficiency has resulted in an accumulation of cash on corporate balance sheets as shown in the chart below. Corporate managers have two charges: 1) to run their operations efficiently; and 2) to allocate the capital generated by its operations. It is the second charge that we will review and discuss in this article.
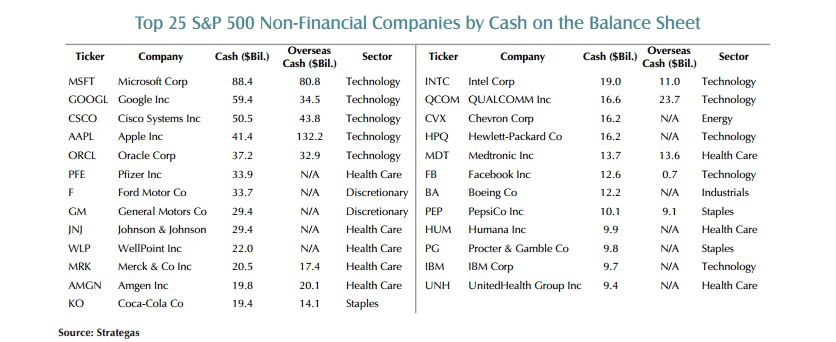
Similar to investors who lost money and confidence during the financial crisis, C-suite executives were also psychologically affected by the Great Recession, and have been inclined to keep an extra cash cushion. We can appreciate their attachment to having readily available liquidity as we remember how credit markets froze, particularly short-term funding sources, during the dark days in 2008. Yet, with cash earning close to nothing, companies are having a harder time justifying a zero-percent returning asset on the books, and activist investors are starting to apply pressure. Certainly, reasonableness comes into play as keeping an appropriate level of cash on hand is prudent to operate a business and necessary to maintain financial flexibility. But companies are ultimately run for the benefit of shareholders who decide whether managers are doing a good job allocating capital.
Companies have five ways to spend their cash, and striking the right balance between the following alternatives may influence to a large degree whether shareholder returns will be poor, mediocre, good, or great. Companies may choose to 1) pay down debt, 2) pay dividends to shareholders, 3) repurchase shares, 4) make capital investments in the business, and 5) acquire other businesses or companies.
In our view, the capital allocation decision is not a “one size fits all” equation, as companies participating in different industries may be subject to different externalities, resources, and constraints. The health and competitive position of a business, macroeconomic and regulatory environment, access to external capital through public debt and equity markets, preferences of its shareholder base, and confidence in the business outlook, are a few of the factors that may influence the cash deployment decision.
Even though cash levels have increased, companies have still been investing in the aforementioned areas over the past several years. However, our take is that until recently, decisions on the whole have been risk averse in nature, reflecting an overall lack of confidence driven by political dysfunction in Washington, heavier regulation, and higher taxes. It has been an easier choice to use cheap money to repurchase shares rather than make a long-term commitment to purchase capital equipment or acquire another business. In the sections below, we highlight some of the trends and implications for how companies have been allocating capital.
Pay Down Debt
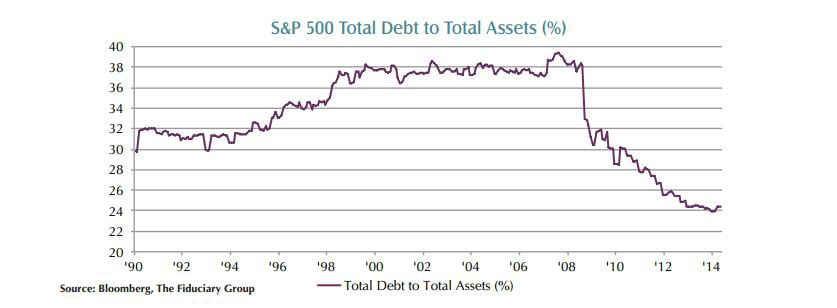
The first order of business for companies during the financial crisis was survival, which was particularly acute for those whose business models were dependent on short-term funding sources or which had too much debt. For some, paying down debt was not a choice but a necessity. For most, a recognition that tough times called for tough measures meant that balance sheet strength and flexibility would be a top priority in a capital constrained environment. As the chart below shows, total debt as a percentage of total assets declined dramatically during 2008-2010 as companies methodically reduced their debt burden. In addition to paying down debt, companies have been able to refinance at lower rates and extend the average maturity of their outstanding debt as capital markets conditions improved. Company balance sheets are now in good shape, allowing them to use cash for more shareholder friendly uses.
Pay Dividends To Shareholders
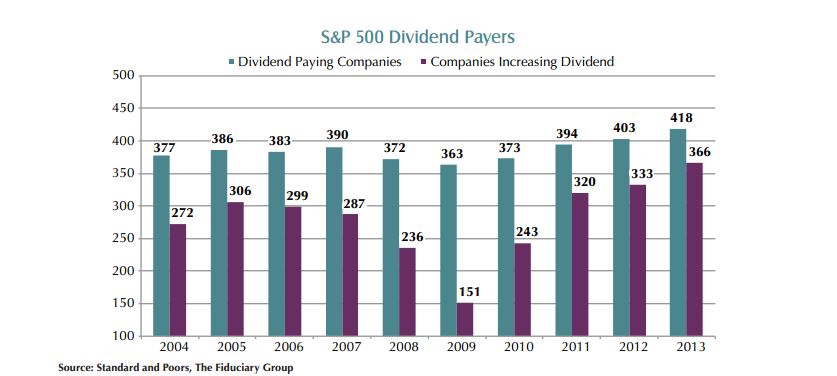
Shareholders can be an impatient bunch, pressuring companies to use it or lose it. Paying dividends is a source of immediate gratification for shareholders as they get to cash a check, and also a signal regarding the longer-term health of a business. It is an unspoken rule on Wall Street that once begun, a dividend payment is sacrosanct, and cutting the dividend is the shortest route to a falling stock price. For many companies, committing to a quarterly payment not only engenders loyalty from its shareholder base, but also adds a measure of discipline to its capital allocation process. At last count, 421 of the 500 companies in the S&P 500 Index paid a dividend, and during 2013, 366 of the companies increased the dividend rate over the prior year. As the chart on the following page shows, the number of companies paying and increasing dividends has steadily increased since the financial crisis.
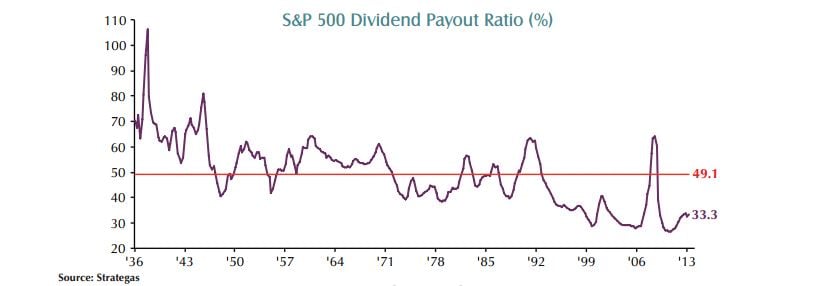
In an investing environment in which fixed income yields have steadily declined, dividend paying companies are meeting a market need. With the 10-year U.S. Treasury yielding roughly 2.5%, the average dividend yield on the S&P 500 of 2% stacks up well. In addition, 140 of the S&P 500 companies now boast a yield above the benchmark The path of least resistance for companies has been to use excess capital to repurchase shares. Coming out of the March 2009 market low, share prices were universally undervalued, making share repurchase a rational decision. In addition, companies have been borrowing money at low rates, using proceeds to repurchase shares, fueling growth in earnings per share. In theory, companies send a positive sign to the market when they repurchase shares as it may indicate that management believes the shares are undervalued. In practice, managers often overestimate the value of Treasury rate. While dividend payments have increased, companies have plenty of room to grow them as the dividend payout ratio (dividends paid/net income) is near all-time lows. As the economic recovery continues, we expect the trend of increasing payments will continue.
Repurchase Shares
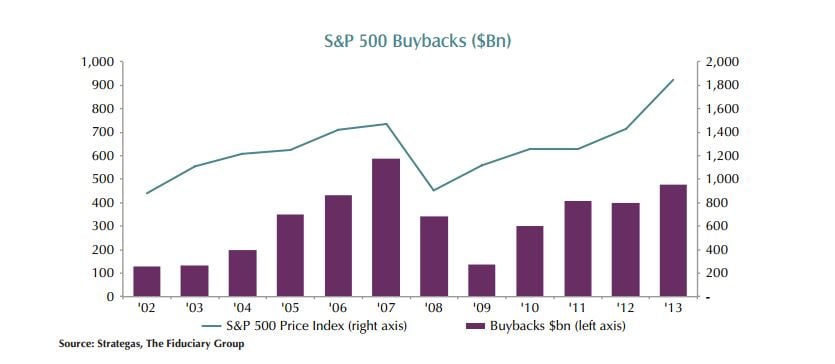
The path of least resistance for companies has been to use excess capital to repurchase shares. Coming out of the March 2009 market low, share prices were universally undervalued, making share repurchase a rational decision. In addition, companies have been borrowing money at low rates, using proceeds to repurchase shares, fueling growth in earnings per share. In theory, companies send a positive sign to the market when they repurchase shares as it may indicate that management believes the shares are undervalued. In practice, managers often overestimate the value of Treasury rate. While dividend payments have increased, companies have plenty of room to grow them as the dividend payout ratio (dividends paid/net income) is near all-time lows. As the economic recovery continues, we expect the trend of increasing payments will continue. the business and repurchase shares at inopportune times. As the chart on the following page indicates, share repurchase activity for the period from 2009 to 2013 increased in stair-step fashion, similar to the period from 2003 to 2007. During both periods, the increase in share repurchase activity coincided with the equity market’s advance. As the S&P 500 Index marks the sixth year of the current bull market, we believe the benefits of share repurchase may begin to be met with skepticism.
Make Capital Investments In The Business
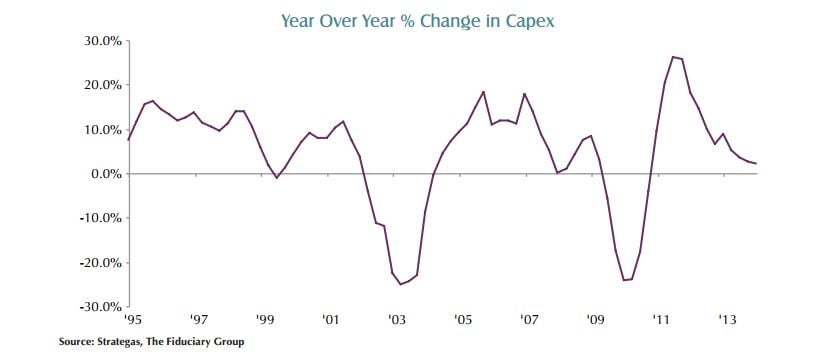
S&P 500 operating earnings growth has far outpaced revenue growth during the recovery, as financial engineering plus efficient business management has produced good earnings. Revenue growth has been harder to achieve as consumer and business spending has been constrained. As the chart below shows, the year-over-year change in capital spending bounced in late 2009 before being derailed by the debt ceiling debate in late 2011 that led to the downgrade of the U.S. debt rating. The rate of change in spending continued to decelerate until recently.
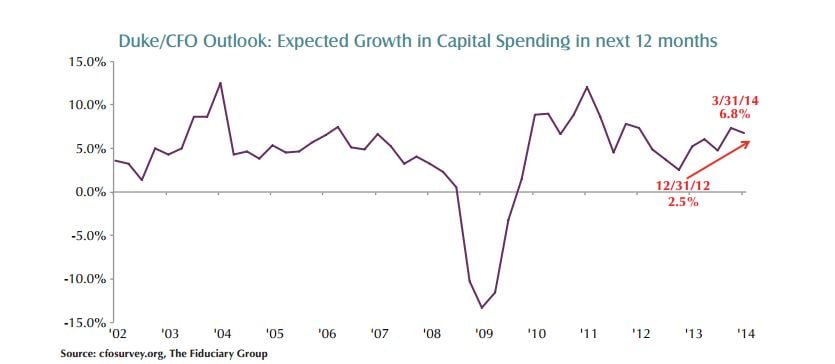
We are beginning to see signs that companies are more willing to extend their time horizon and make capital investments. Data from the Duke University/ CFO Magazine global business outlook survey shows that chief financial officers expect to increase capital spending by 6.8% in the next twelve months. In our view, these investments, along with merger and acquisition activity will be the key to generating revenue growth that will in turn sustain further earnings growth.
Make Acquisitions
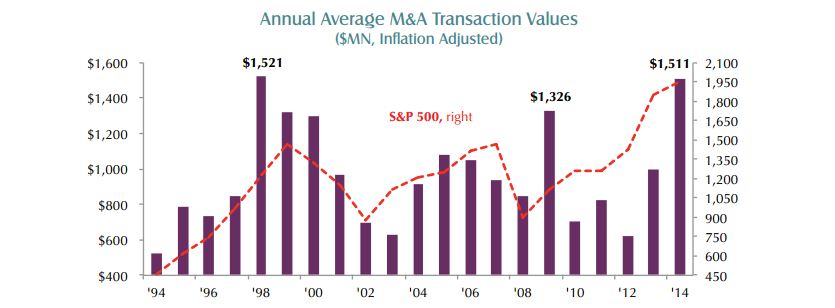
Rising stock prices, attractive financing, and the need to generate revenue growth are supporting a surge in merger and acquisition (M&A) activity. As the chart below indicates, annual average M&A transaction values are higher than the previous peak in 2009 and on par with 1998. While the uptick in M&A activity speaks well regarding the outlook for the economy, an overheated M&A market has historically been associated with an exuberant stock market. Successful mergers are best measured in hindsight, as strategic fit, price paid, and synergies realized are seen in the fullness of time. We are mindful that the level of M&A activity bears watching, but so far are encouraged that many of the recent deals have made strategic sense and have been financed with stock and cash, rather than only stock.
Capital allocation decisions are perhaps the most underappreciated and difficult task that company management teams must perform. Balancing short and long-term goals and maintaining financial flexibility while deciding how to invest the scarce resource that is the company’s capital will determine whether shareholder value is created or destroyed. As investors ourselves, and as investment managers at The Fiduciary Group, one of our goals is to identify those management teams that have a track record of making good capital allocation decisions and construct well diversified portfolios consisting of these well-run companies.
